
Welcome to ProjeQtOr new Forum. We migrated old forum to the new website.
You will find all your posts here, with your usual account.
Just one point : you’ll have to reinitialize your password. Use “Lost password” feature.

Hi Babynus,
the left value of Y-axe in "workplan per week" didn't spend sense to me.
Klaus

On this graph :
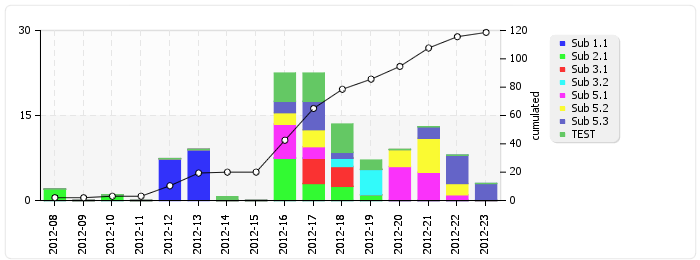
Y axis has 2 values :
- on the left, the unitary value, per week (bar values)
- on the right, the cumulated value (line value)
But there is an issue : on this graps, values are always displays as days :huh: , not taking into account choosen unit 🙁 , and in your case, board may be on hours, so unit does not fit :whistle:.
Ah, that explains, why I didn see a sense.
One bug is fixed, I suggest, it should be mentioned in legend of chart, how axes to be read.
Klaus